Understanding the Strategile Dashboard
The Strategile dashboard is intended to assist executives, leaders and individuals to understand how the organization is performing against its strategic thrusts (2-3 years plans), business goals (physical year) and risk and opportunities. Futhermore, the dashboard allows leaders to drill down into portions of each focus area to assess how the company is performing and where challenges lie ahead. Finally, the dashboard allows individuals to update the status of key actions in support of the future plans of the company with “one-click” monthly status actions.
The Strategile dashboard is structure in 3 distinct focus areas:
- Strategic Thrusts
- Business Goals
- Risks & Opportunities

Tabs with a focus areas are filtered to provide a distinct view (Strategic Thrusts, Business Goals and Risk & Opportunities) based on the Entire Company, My Organization and My Actions.
- Entire Company
- Provides the historical performance (line graph) of the actions in-process
- Future due dates (bar graph) of actions in-process
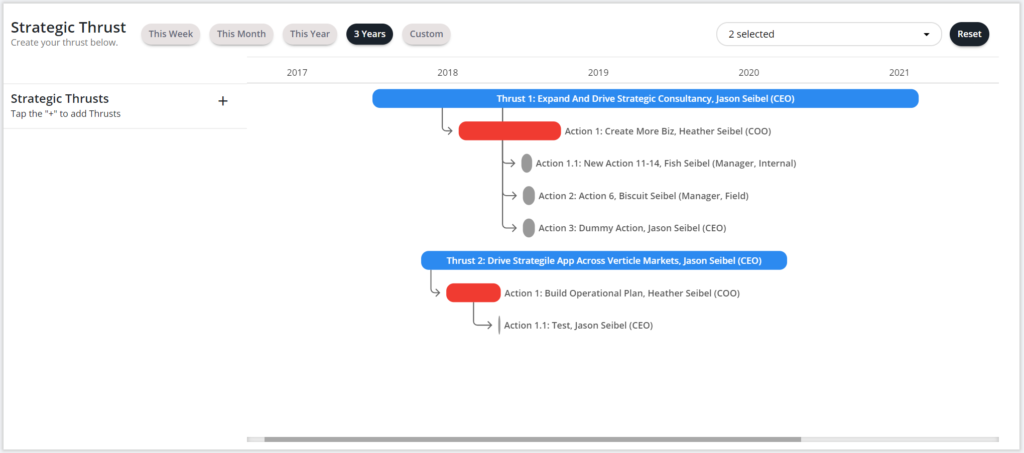
- A Gantt bar chart view of how those actions are organized
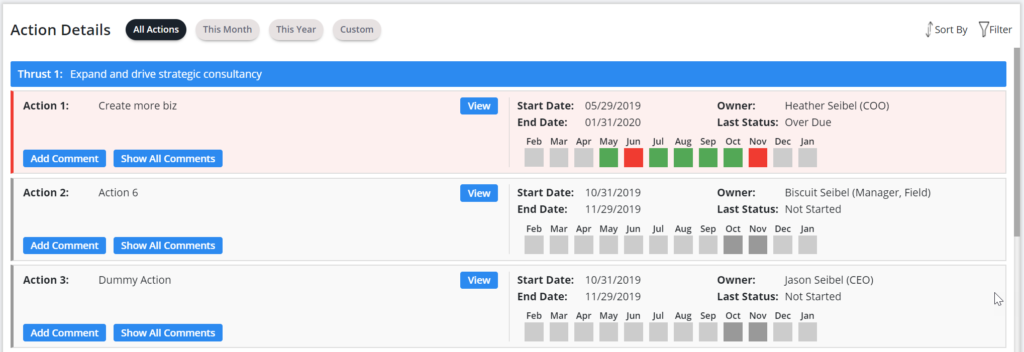
- A list of actions and their status
- My Organization
- Default filtered version of the “Entire Company” based on the current logged in user and its subordinates
- A filter option to select another leader (superior, peer or subordinate) and its subordinates to view a list of actions within their organization
- An ability to write comments against an outstanding action
- View a list of outstanding Requests for Action – requests made by leaders in the organization to support an upstream action
- My Actions
- A filtered version of “My Organization” that ONLY includes actions and outstanding Requests for Action related to the logged-in user
Two graphs represent the historical status of the action items (line) and the future due date (bar) and latest status of the action items. The goal is to provide a visual representation of historical and future performance of the actions supporting the company’s Strategic Thrusts, Business Goals and Risk & Opportunities.


A filtered Gantt chart visually depicts the Strategic Thrusts (in this example), its action items, status and owner. Note: the Gantt can be filtered by thrust to reduce the number of items on the screen.

A list of actions, owners, latest status with the ability for any user to provide status allows leaders or individuals to see the status of each action. The list can be filtered by name or status. See upper right corner.

A list of outstanding “Request for Actions” where individuals have had a request to create an action (aka cascaded) but has not yet responded. A reminder can be sent to the individual.

